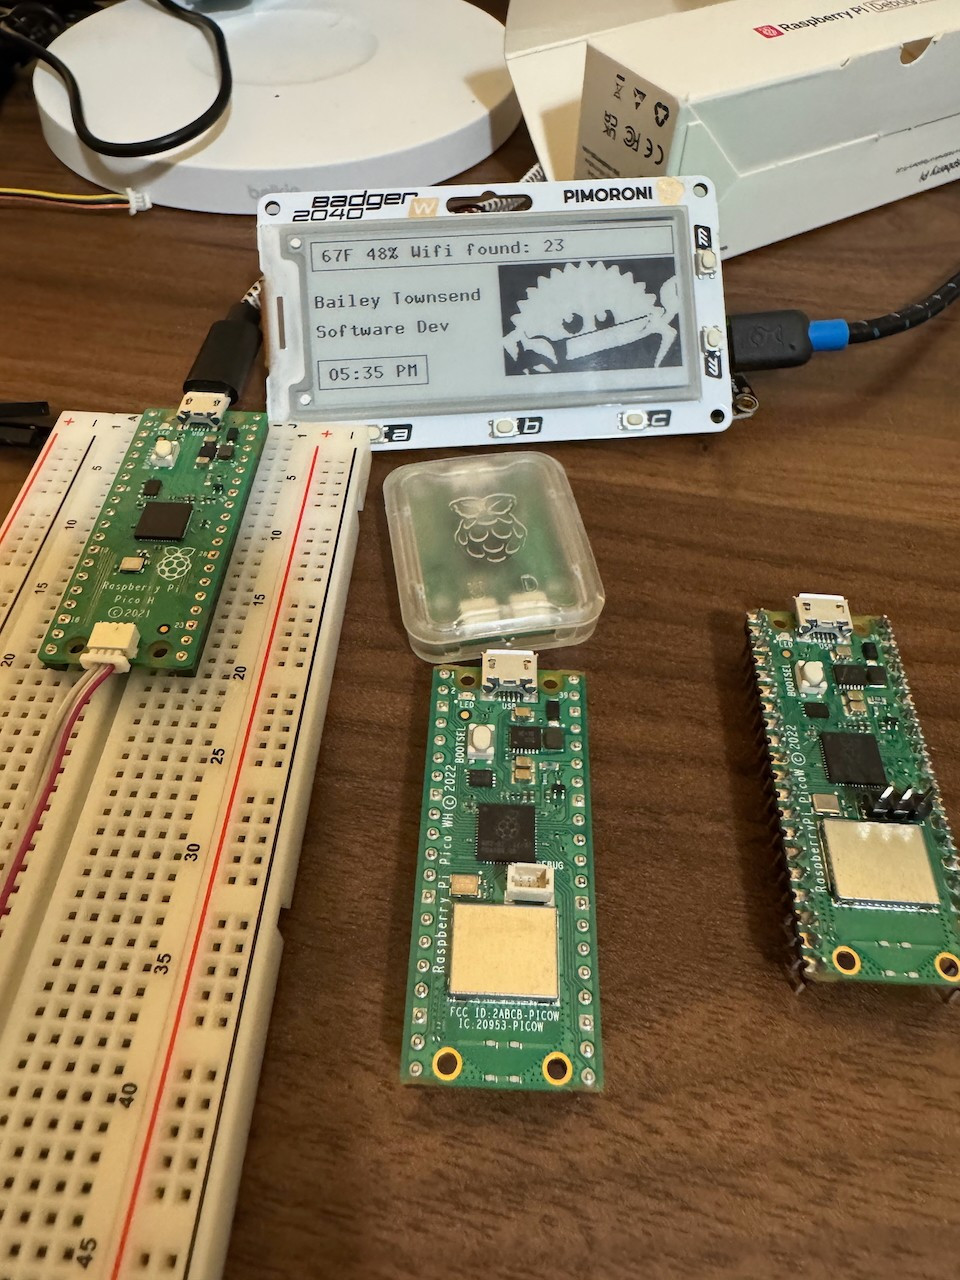
Rust 🦀 on the RP2040
11/28/2024, 5:50:00 AM
As previously seen on Bluesky 🦋
Welcome to my mega 🧵 on getting started with Rust on the RP2040! This thread aims to get you started with writing Rust on the Raspberry Pi Pico. The actual end result will just be a blinking on-board LED. It’s up to YOU to take this foundation and make awesome projects from it.
This is a “There are no dumb questions” thread. Got a question on something? Reply to the post on Bluesky! And I will do my best to answer it and help you get going. From now on, when I say “Pico,” I am referring to either the Pico 1 with or without wireless. This can be done with either. It is recommended to have some familiarity of Rust and this guide is geared towards that, but this guide should be helpful enough to get you from zero to a pico running rust.
Hard Requirements:
- A computer (any OS, but I can only help with Mac or Linux)
- Rust installed
- rustup target thumbv6m-none-eabi
- 1 Pico and the Debug probe
OR
- 2 Picos (Can be Pico 1's or 2's, or even W's)
Nice to haves:
- Breadboard
- Jumper Wires
Table of Contents
Software setup
- Install rust using https://www.rust-lang.org/tools/install
- Once installed, run
rustup target add thumbv6m-none-eabito add the target for the RP2040 - Install Probe-rs following https://probe.rs/. Make sure to follow the Installation section in Getting Started. * Linux users will need to setup udev rules
Project setup.
We will be using the Embassy on this 🧵, and for your convenience, I have a template you can use to get started! Clone this repo.
- If you’re using the Pico(non W) use the branch pico_non_w
- If you’re using the Pico W use the branch main (They have different ways to toggle the LED)
What to buy
This step is completely optional. But If you do not have a pico yet, then I HIGHLY recommend picking up a Raspberry Pi Pico Debug probe and a Pico W with the debug port from @pimoroni, both listed below. This will make everything so much easier
Raspberry Pi Pico W W/ headers and debug port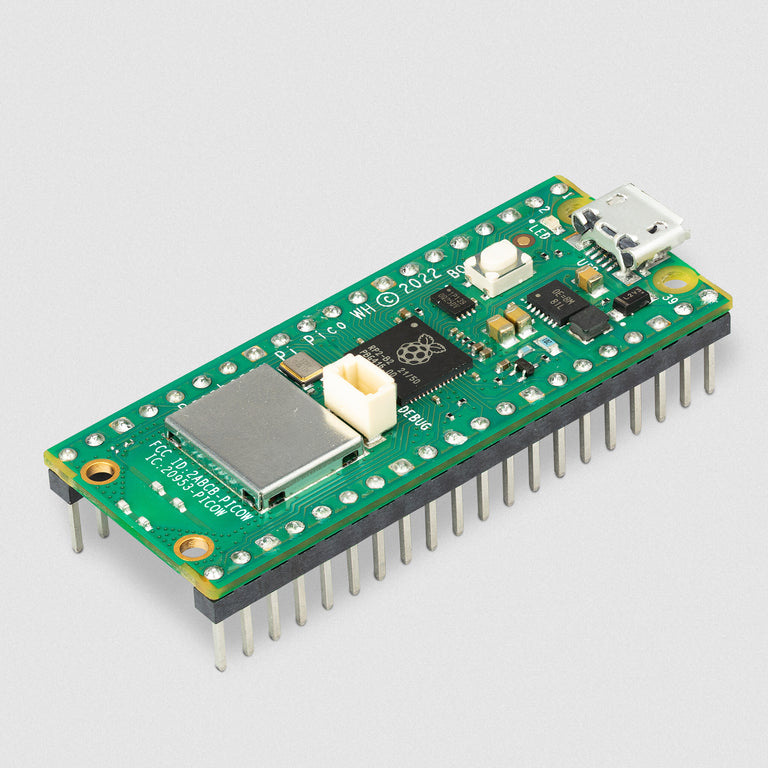
Debug probe setup
In this 🧵 we are using a debug probe to flash the Pico. You can manually move a UF2 over every time, but I want to set you up with the best way to write Rust on the RP2040.
The benefit of us doing it this way is using a Debug probe you get.
- The ability to flash a new firmware without touching the pico
- Logging using defmt
- Breakpoints
- Did I mention you don't have to hit BOOTSEL and re plug the pico everytime?
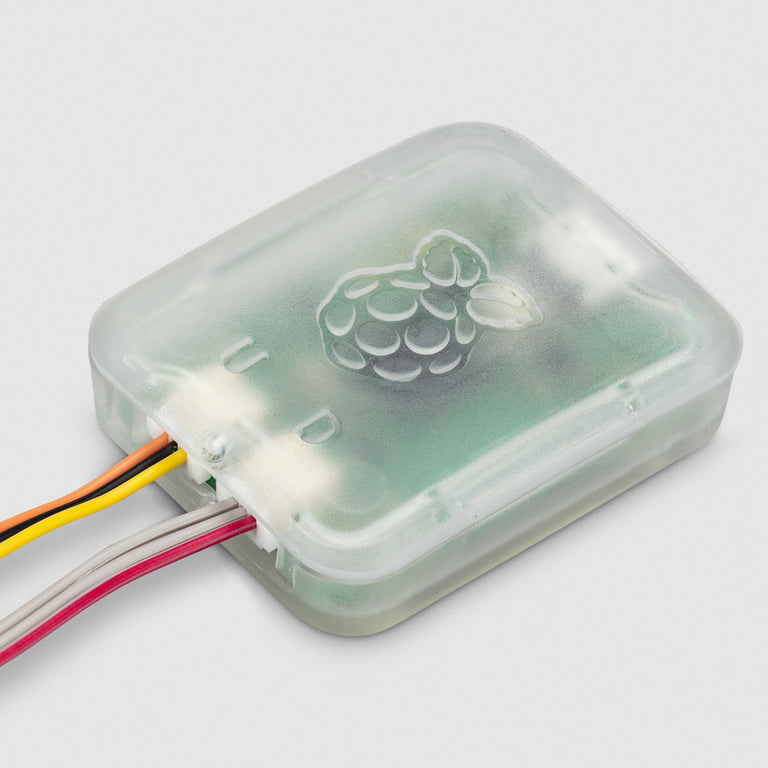
I recommend buying the Raspberry Pi Debug Probe , but you can also use a spare Pico. This guide will cover both.
Raspberry Pi Debug Probe setup
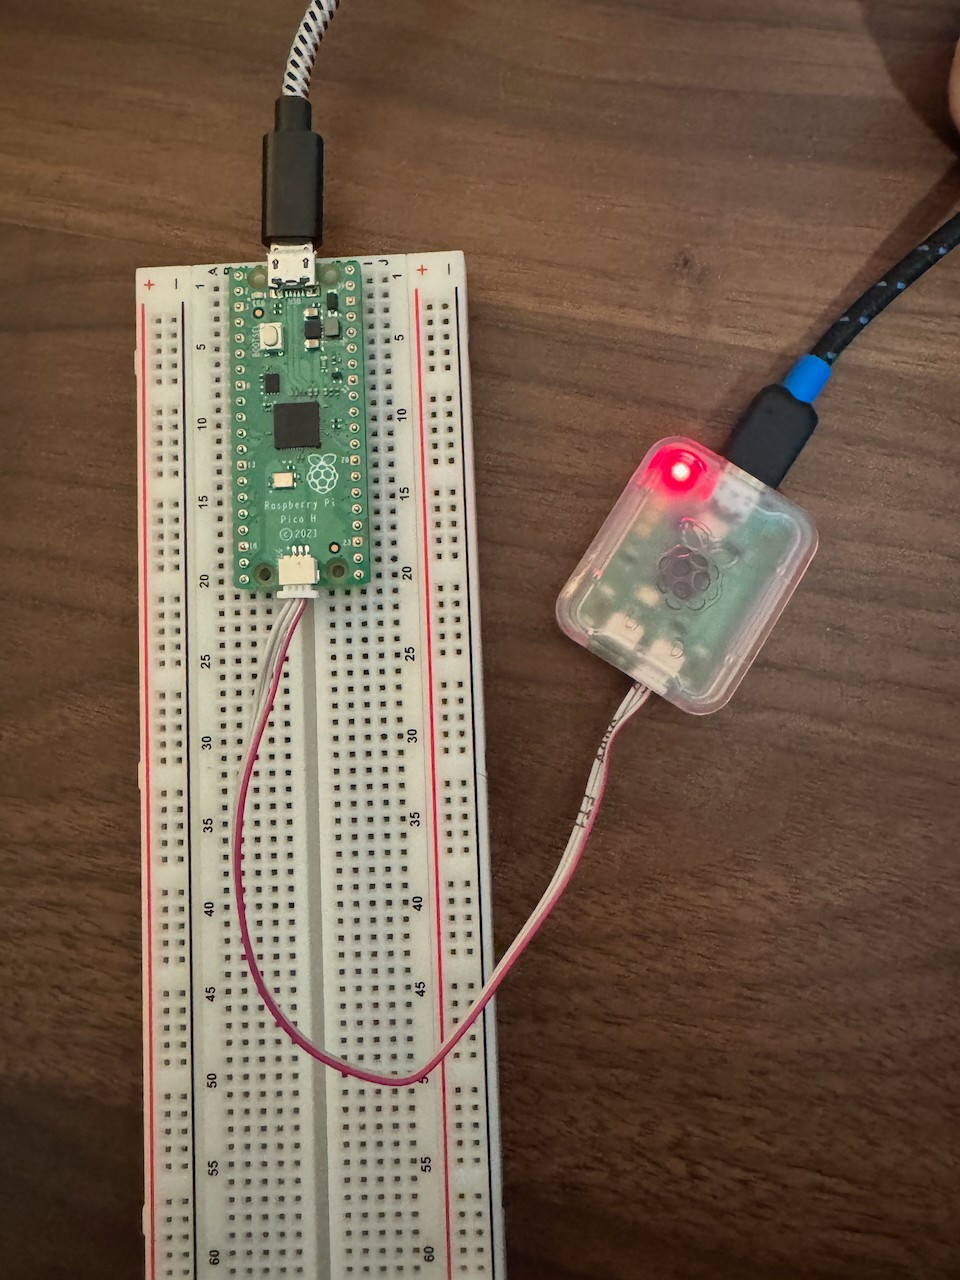
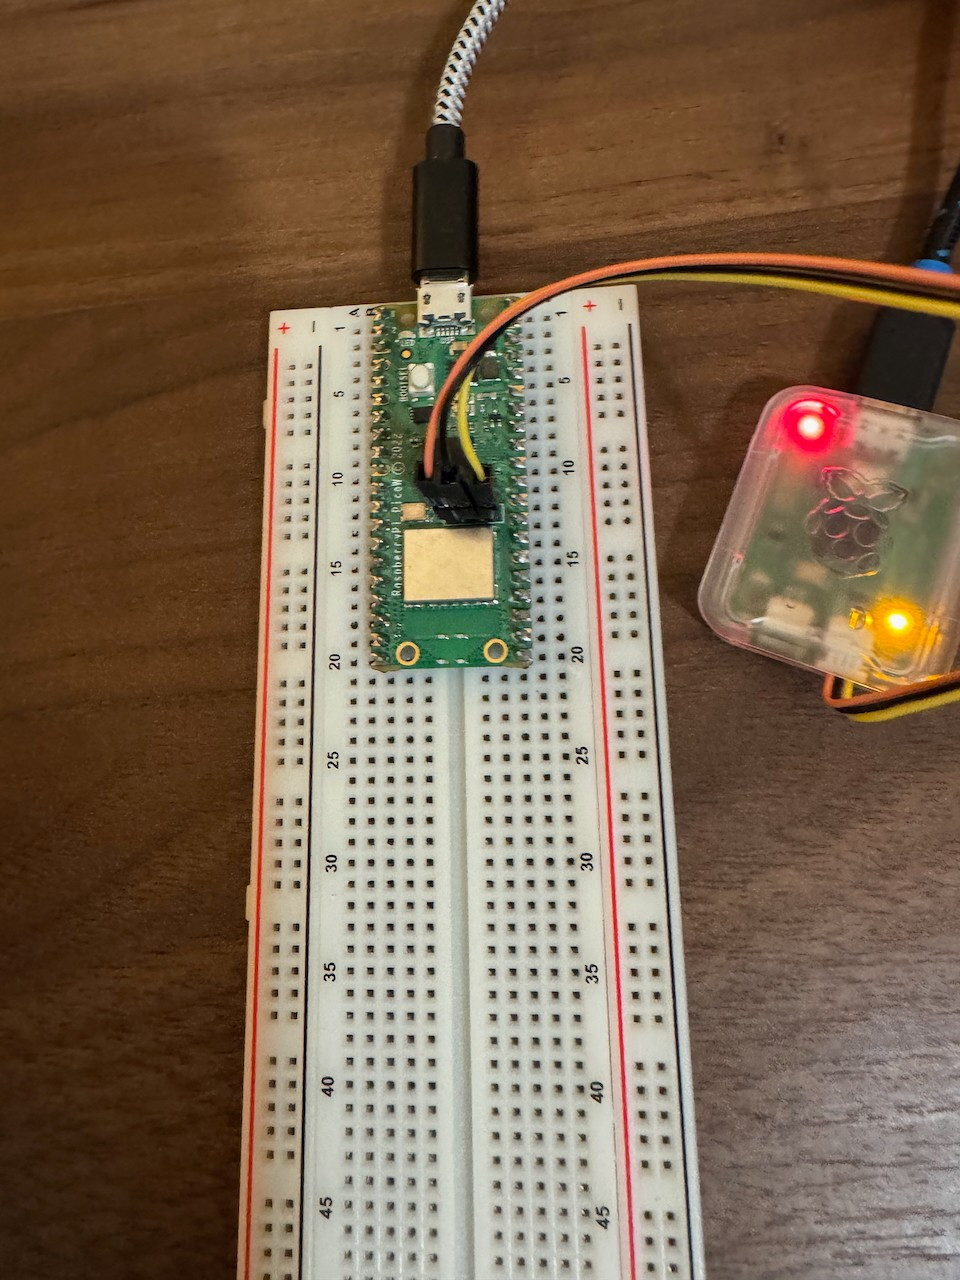
If your target Pico has a three-pin JST-SH port, you can connect the JST-SH cable from the port on the right of the probe(Marked D) to the Pico's Debug port
If your pico does not have the three-pin JST-SH port you will need to solder a 3 pin header to the debug port of your pico
If that was as clear as mud, You can check out the Raspberry Pi Debug Probe Documentation page for more info on wiring. Refer to the previous image if you have to use the jumper wires. From left to right; Orange (TX/SC), Black (GND), Yellow(RX/SD)
Using a second pico as a debug probe
You can use a spare Pico as the debug probe (You can also use a Pico 2 for this step). Raspberry Pi has excellent instructions on setting up the software on your Pico being as a debug probe. It boils down to downloading the uf2 listed and flashing it to your device.
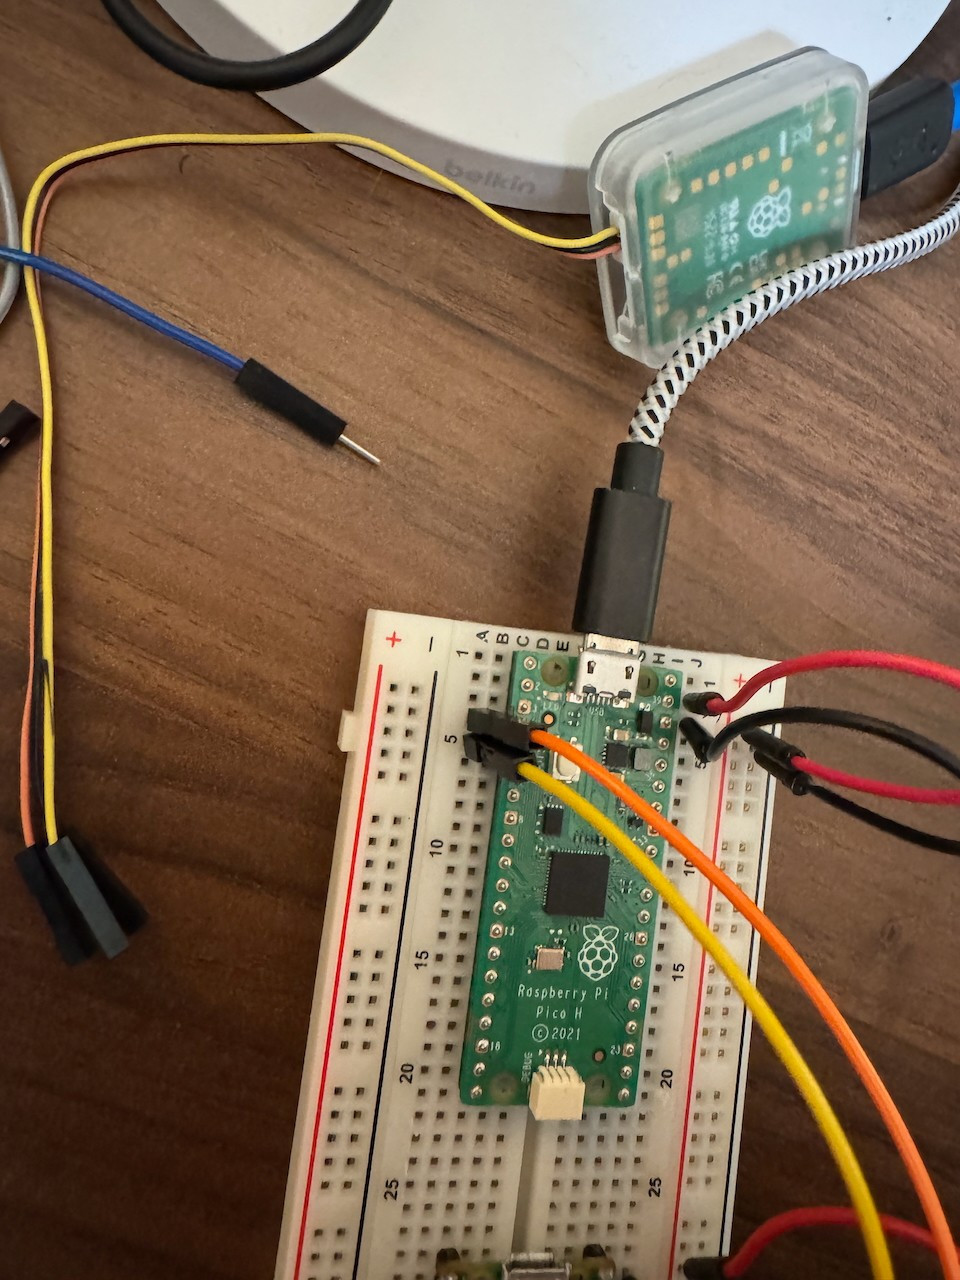
Using a pico as the debug probe can look a bit more daunting to set up. But it’s much the same as using the Debug Probe. Pico A is the Probe B is the target
I power the target from the probe. In the picture, I give power/GND from A to B on the power rails in the breadboard. VSYS → VSYS, GND → GND
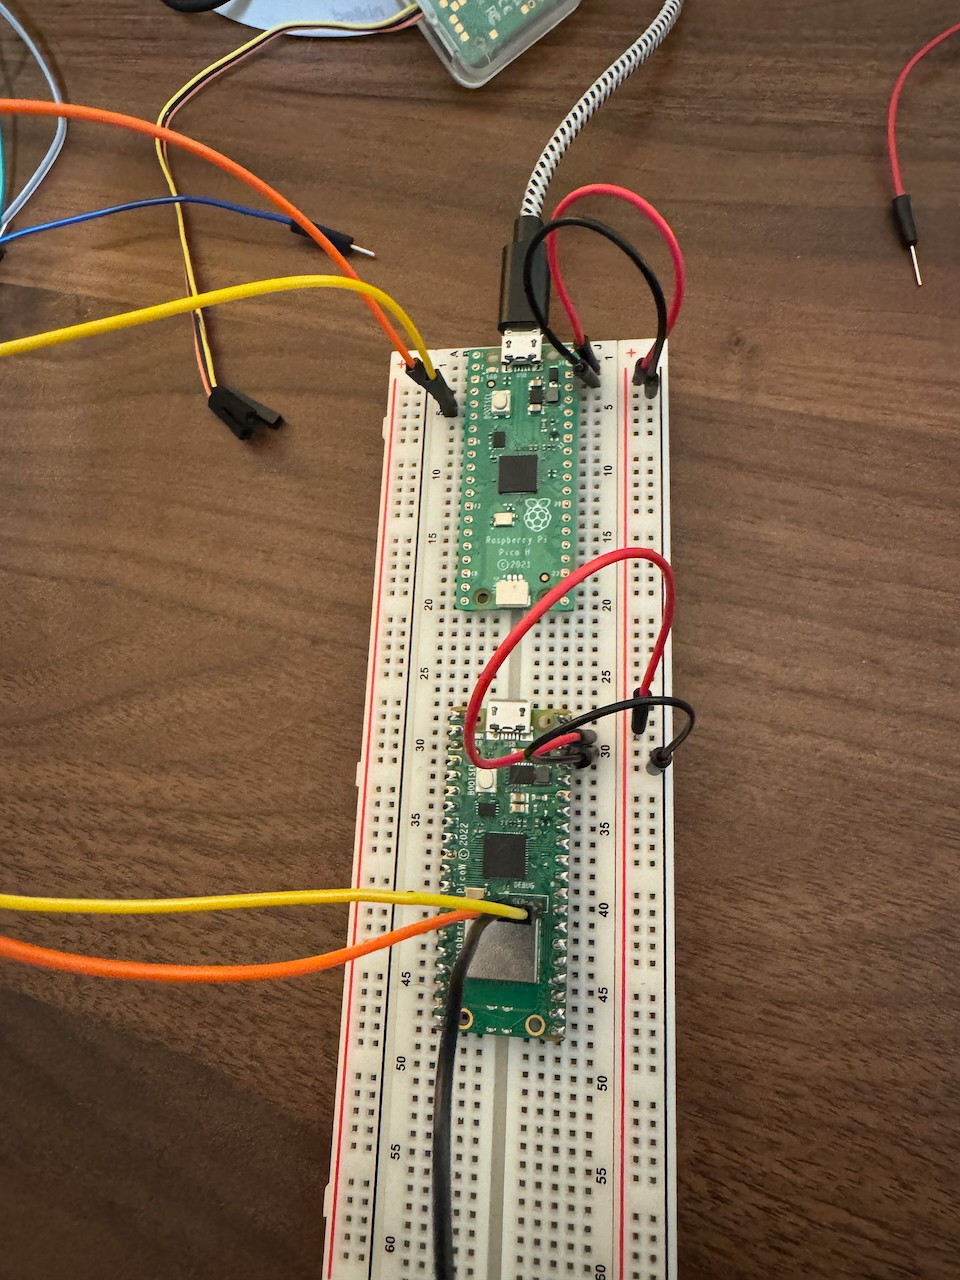
Then we connect
- Pico A GPIO2 → Pico B SWCLK(Orange cable) on the area marked debug
- Any Pico A GND(or breadboard GND rail) → Pico B Debug GND
- Pico A GPIO3 → Pico B SWDI0(Yellow Cable) on the area marked debug
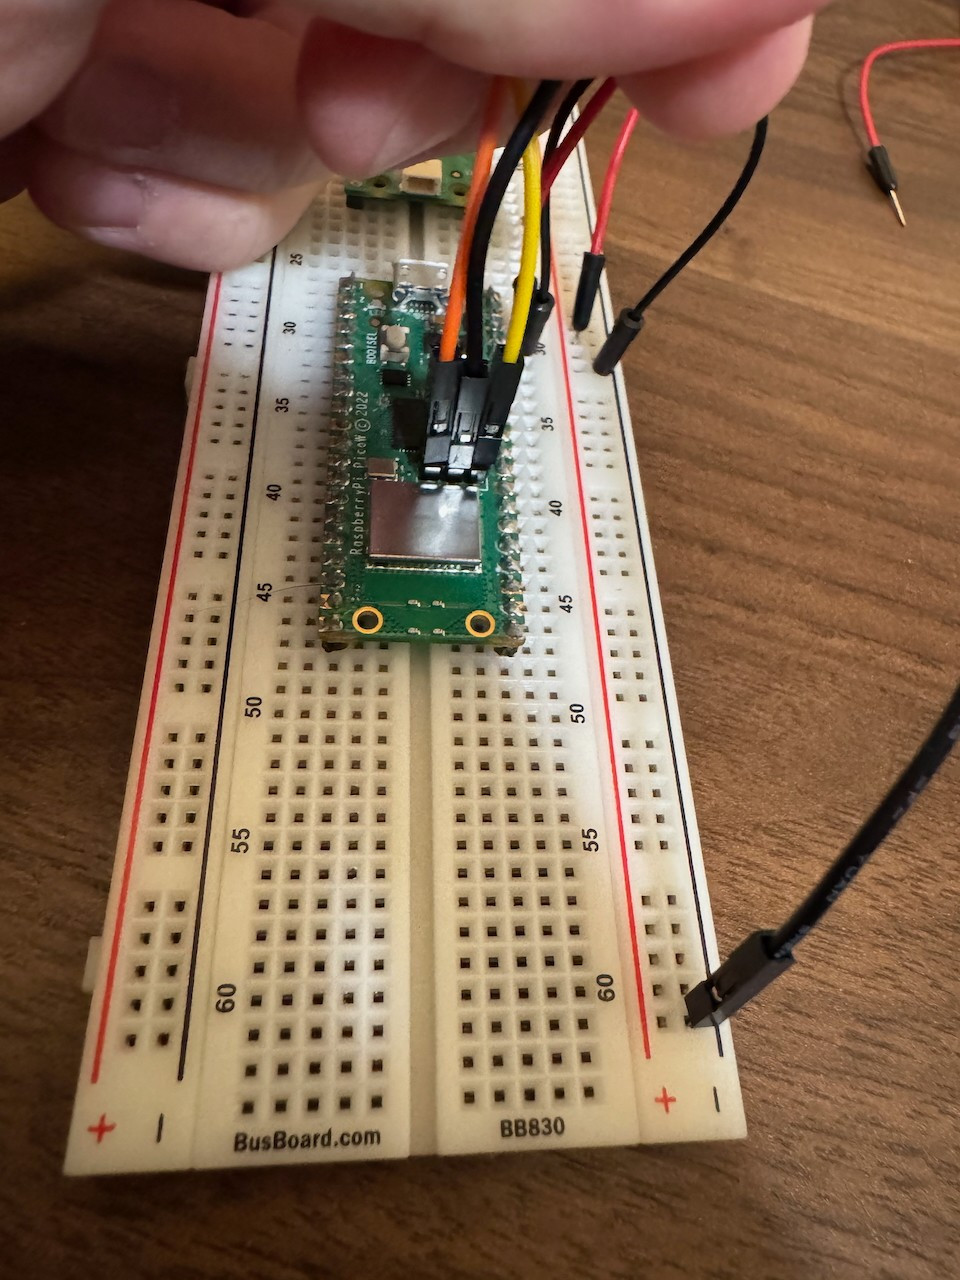
- Orange (TX/SC)
- Black (GND)
- Yellow(RX/SD)
If you have any issues, you can refer to page 18 of this PDF
Note: You may have noticed that we did not connect UART on either of those, as shown in the documentation. That is because it is not strictly needed for what we are doing. But it should be noted if you do anything you send on UART0 from the target can be read via the serial connection the probe
Flashing the Pico.
This is as easy as navigating to the repo you cloned earlier in your terminal/code editor/IDE of choice, and running cargo run probe-rs takes it from here and flashes the target. You should now be logging in to your terminal, and the LED is flashing!
Video of the pico flashing it's onboard LED
Congratulations 🎉!
You have now have a great foundation for using the Rust framework Embassy to write amazing applications for the RP 2040. You should now be able to take any example from Embassy’s GitHub repo and run them locally using this template as a base.
https://github.com/embassy-rs/embassy/tree/main/examples/rp/src/bin
If you have made it this far, thank you so much for checking out this thread! Please feel free to ask me any questions and reply or quote this post with any projects you make using this! I hope it helps you out!
